This blog is part of the blog series: Top7 Challenges for R&D Labs Operations and Digitalization: Insights from our Clients.
Learning from the past
Predicting the next experiment to run and the optimal parameters to set are primary objectives for most scientific organizations, to accelerate the experiment cycle and ultimately the time-to-market.
The recent advancements in AI/ML technologies have made these goals increasingly attainable. However, the challenge lies not just in the technological capabilities but also in gathering rich, valid datasets to train these models. As a result, IT teams, supported by data scientists, often emphasize the importance of extensive and digital data documentation to the scientists and try their best to enforce it.
"We aim to harness our data for predictive analytics. Ensuring data quality and accuracy, and minimizing human errors are crucial steps toward this goal. Our objective is to utilize results and insights from tests conducted across different locations for the benefit of all our teams," shares the Head of Product Development at a Chemical company
How to digitally capture data?
The classic solution brought to scientists to get this data digitalized is to provide them with an electronic version of their classic lab notebook, which became the famous Electronic Lab Notebook (ELN). However, as discuss in our first blog, ELN adoption has been quite a challenge. Its interface can be cumbersome for a scientist at the bench, especially when wearing gloves and not being in close proximity to a computer. Many scientists still prefer to jot down notes on paper, later spending time retyping them into the ELN with some delay. When paper is prohibited in the lab due to IT restrictions or specific lab conditions, scientists often resort to relying on memory to remember their observations, sometimes for hours, as they didn’t have a better solution at hand.
"In our polymer synthesis lab, paper is not allowed due to the chemical we handle there. We still need to record some observations, such as how the fiber is acting. And at the moment, a process looks like the following:
- Recall everything from memory in the lab
- When done in the lab, run to the office (usually pretty stressed)
- Grab the first piece of paper and write notes down,”
describes a Manufacturing Engineer from a Chemical company.

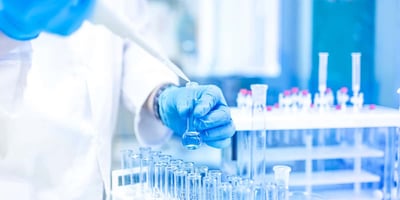
Picture of a scientist in a glove box, unable to document on paper or computer.
Capturing more data with the right interface
Well, that was not the case for those who could use a digital lab assistant as LabTwin for hands-free data capture.
“With LabTwin, I capture more notes than I used to. I'm convinced that my documentation is better and more reproducible. For example, I now note which type of stirring I am doing as well as the conditions (there are 10 types of stirring). I can also note details like whether a solution is sticky or cloudy," mentions a Scientist at a Top10 Pharma company.
With such an interface designed to be as smooth as possible for scientists to use while running their experiments, scientists not only digitalized all their data in real-time, but also captured an average of 12.5% more data (based on an analysis on 10 LabTwin client companies). Simply because using their voice instead of their hands is the most convenient way to capture data without losing their focus on the experiment. Moreover, the voice assistant can prompt for mandatory data capture at specific experiment steps, reducing the risk of forgetting to record crucial information.

Analysis conducted on 10 LabTwin client companies from different industries, to showcase the impact of implementing a digital lab assistant. In grey is represented the amount of data recorded at the bench, either on paper or computer. In pink, we show the amount of data that couldn’t be recorded during the experiment and had to be retained in memory, posing a risk of errors during recalling. On average, this accounts for 21.6% of the data, with significant variability between companies. In blue, we indicate the amount of extra data that was captured through facilitating data capture at the bench, ranging from 0 to 33% with an average of 12.5%.
Keeping data in memory, a risk for data integrity
From the same analysis of 10 clients, we measured that on average 21.6% of the data was kept in memory during experiments, then later transcribed onto paper or entered into a computer. Scientists themselves recognized this as a risky practice, often resulting in errors during recall, especially when the information was deemed critical for the experiment's success.
"Sometimes, I notice a discrepancy between samples in the analysis results and I suddenly remember that I actually saw something different during the experiment, but I cannot remember what it was anymore. So I have to redo this part of the experiment, which could take 10min or a full day, " shares a Senior Associate Scientist, Food and Beverage company.
In a test with a subset of scientists, we collected a couple of recorded information in LabTwin that they said they would have otherwise memorized. We then asked them to keep it in memory for simply 30s (time to finish a task) and then write it down. We discovered that 22% of their notes recalled from memory contained errors. 22% (average amount of recalled data containing mistake) of 21.6% (average amount of data kept in memory) makes 4.7% of the dataset containing errors! This not only affects the performance of predictive models digesting this data, but also directly impairs the reproducibility of experiments within the team.
 This graph represents the average amount of data kept in memory during experiments (pink), the subset considered being critical information (dark red) and the portion which contains errors at recalling (dashed red). At the top is the average amount of extra data that scientists were able to capture thanks to LabTwin (in blue) and the subset of this data that was considered critical for the experiment (dark red).
 "I'm convinced that my documentation got better, more reproducible, by using LabTwin. Other people can now continue or replicate my work,” adds an Associate Principal Scientist at a Top10 Pharma company.
Notes and pictures, all in one place
A dedicated app for bench data collection enables scientists to include photos taken with their phones directly in their notes and add voice descriptions. This enriches the documentation with extra details, prevents the loss of data across different platforms and improves security by by keeping proprietary data like sample photos off public platforms such as Google Photos.
“Before, taking picture (of a cloudy sample for example) required emailing it to myself and then copy paste it back into the experiment where it belongs. This is a huge barrier. Now it is simply automatically embedded within the corresponding notes”, explains a
Scientist at a Top20 Pharma company.
User-centered interface is key
To capture accurate and richer data from bench scientists, it is essential to understand their constraints and select the solution with the least friction which can be seamlessly integrated into their workflow. With the recent advances in AI providing more and more options for natural ways of communication as inputs, it is an excellent opportunity to greatly facilitate the interactions between scientists and their lab informatics software.
Book a short call with our experts to discuss your current challenges and how we can help you capture richer data.

%20(1)-1.png?width=164&height=164&name=Ellipse%2052%20(Stroke)%20(1)-1.png)